Project Overview
Interactive Tableau Dashboard - Comprehensive customer satisfaction analysis with geographic insights
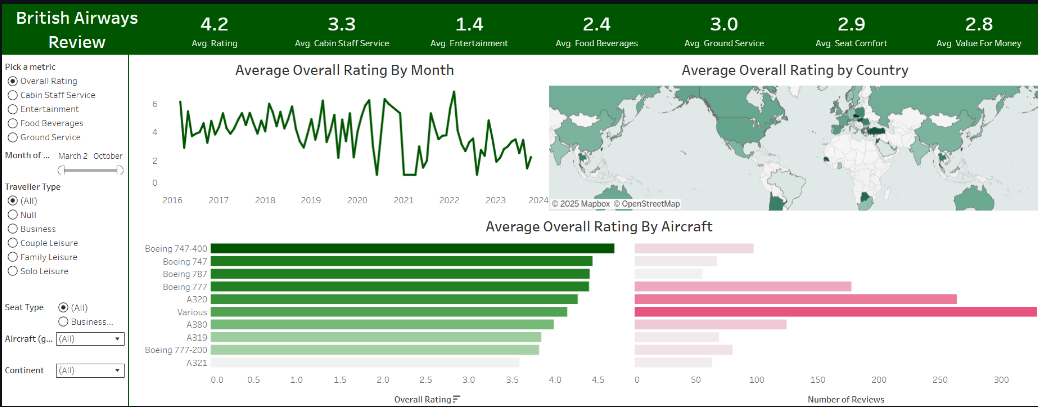
This project involved creating a comprehensive interactive Tableau dashboard to analyze British Airways passenger satisfaction and reviews across multiple dimensions. The goal was to provide airline management with data-driven insights to enhance customer experience and operational efficiency.
🎯 Key Objectives
- Customer Satisfaction Analysis: Understand passenger satisfaction levels across different routes and services
- Geographic Performance Mapping: Identify regional variations in customer experience and ratings
- Operational Insights: Pinpoint areas for improvement in service delivery and customer support
- Trend Analysis: Track satisfaction trends over time to measure improvement initiatives
- Competitive Benchmarking: Compare performance metrics against industry standards
📊 Dashboard Features
🌍 Global Geographic Mapping
Interactive world map showing regional rating disparities and customer satisfaction by location.
📅 Dynamic Date Filtering
Time-based analysis to track satisfaction trends and seasonal patterns in customer reviews.
✈️ Aircraft Type Analysis
Compare customer satisfaction across different aircraft types and configurations.
👥 Passenger Demographics
Analyze satisfaction levels by passenger type, class of service, and travel frequency.
🔍 Key Insights & Analysis
The dashboard provides comprehensive insights into:
- Regional Performance: Geographic hotspots of high and low satisfaction ratings
- Service Quality Metrics: Detailed breakdown of ratings across different service categories
- Customer Journey Analysis: Satisfaction levels at different touchpoints of the travel experience
- Operational Efficiency: Correlation between operational metrics and customer satisfaction
- Improvement Opportunities: Data-driven recommendations for service enhancement
🛠️ Technical Implementation
The dashboard was built using Tableau's advanced visualization capabilities to create an intuitive and interactive user experience:
- Interactive Filters: Dynamic filtering across multiple dimensions for detailed analysis
- Real-time Data Connection: Live data integration for up-to-date insights
- Responsive Design: Optimized for various screen sizes and devices
- Advanced Visualizations: Maps, charts, and graphs for comprehensive data representation
- User-friendly Interface: Intuitive navigation and clear data presentation
💼 Business Impact
This analysis provides valuable insights for:
- Service Improvement: Identify specific areas for customer experience enhancement
- Route Optimization: Make data-driven decisions about route performance and expansion
- Resource Allocation: Allocate resources based on customer satisfaction priorities
- Competitive Strategy: Benchmark performance against industry standards
- Customer Retention: Develop targeted strategies to improve customer loyalty
🔗 Access the Dashboard
Experience the interactive dashboard firsthand to explore all the features and insights: