Project Overview
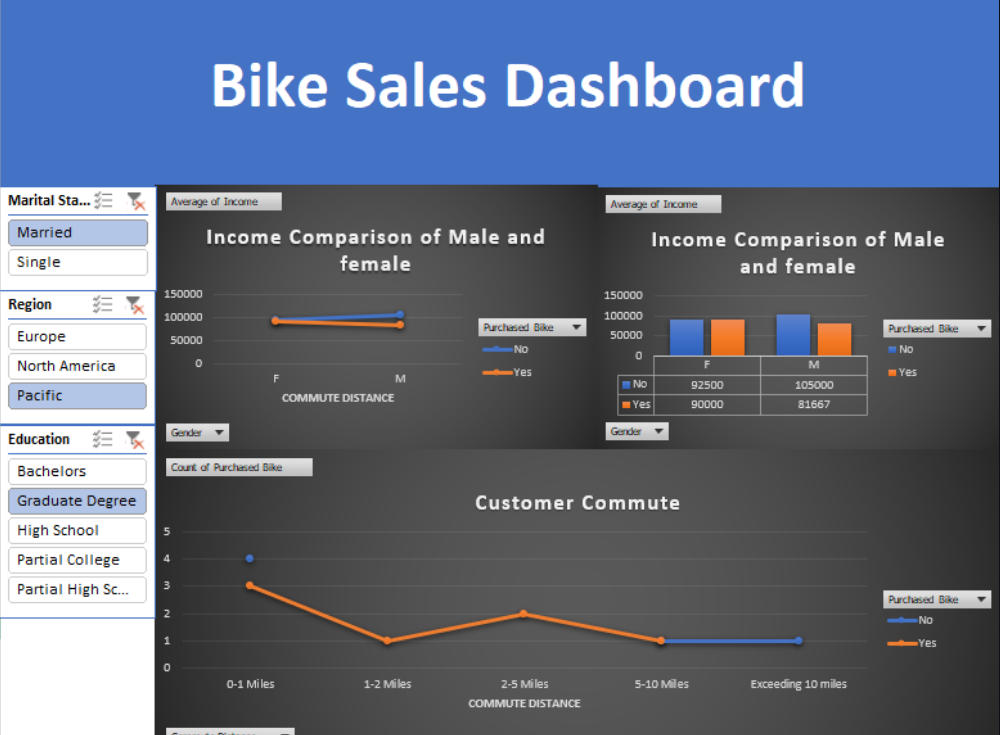
Interactive Excel Dashboard - Comprehensive bike sales analysis with dynamic filtering capabilities
This project is designed to provide a deeper understanding of how various factors influence bike sales, including customer demographics, geographic distribution, and purchasing behavior patterns. The interactive Excel dashboard enables businesses to make data-driven decisions for optimizing sales strategies and marketing campaigns.
🎯 Key Analysis Factors
- 🧍♂️ Gender: Analyzing purchasing patterns across different genders
- 💰 Income Levels: Understanding how income brackets affect bike purchases
- 🚗 Commuting Distance: Examining the relationship between commute range and bike preferences
- 🌍 Geographic Regions: Regional analysis for targeted marketing strategies
- 🎓 Education Levels: Correlation between education and purchasing decisions
- 💍 Marital Status: Family demographics and their impact on sales
📊 Why This Matters
By analyzing and visualizing these key demographics, bike shops and marketers can gain actionable insights to:
- 🎯 Optimize their sales strategies based on customer behavior patterns
- 🧠 Identify target audiences more effectively through demographic segmentation
- 🌍 Tailor marketing based on region and customer behavior for maximum impact
- 📈 Improve conversion rates by understanding customer preferences
- 💰 Maximize revenue through targeted pricing and promotion strategies
🛠️ Features of the Dashboard
📍 Regional Analysis
Change regions to explore how location impacts bike purchases and identify high-performing markets.
🎓 Education Filtering
Filter by education level to see how academic background influences purchasing decisions.
💍 Marital Status Trends
Check marital status for trends related to relationship demographics and family purchasing patterns.
🧑🤝🧑 Demographic Comparison
Compare genders, income groups, and commute ranges with interactive visuals for comprehensive insights.
📈 Interactive Capabilities
The dashboard features dynamic charts and filters that help make complex data easy to understand and actionable. Users can:
- Filter data in real-time across multiple dimensions
- View trend analysis with interactive time-series charts
- Compare demographic segments side-by-side for strategic insights
- Export insights for reporting and presentation purposes
💼 Business Impact
This analysis provides valuable insights for:
- Sales Strategy Optimization: Tailor approaches based on customer demographics
- Marketing Campaign Design: Create targeted campaigns for specific customer segments
- Inventory Management: Stock bikes that align with customer preferences
- Pricing Strategy: Set competitive prices based on income demographics
- Geographic Expansion: Identify promising new markets for business growth
🔗 Access the Dashboard
Experience the interactive dashboard firsthand to explore all the features and insights: